Designing charts to learn about designing charts
Tagged: Data | Posted: Wed, Jan 25, 2017 approx. 4 min read
In my previous blog post I explained how I’ve been logging my film watching with a google spreadsheet hooked up to some simple tools, now I’ll describe how I took that info and turned it into a visually appealing chart.
Onto the next step - deciding how to explore and visualise the ‘data’
Earlier on in the year I’d had a go at the Learn to code for Data Analysis course, which was great at illustrating how much I didn’t know. I managed to make a reasonable way through the course, but I found the statistical rigour needed was a bit much for me. Also, the WHO datasets used In the course didn’t really capture my imagination. I found it difficult to come up with interesting questions for the data. Working with more personal data has made it easier to stay interested and motivated (or self obsessed).
Designing Data charts is something I’ve always been interested in, and done occasionally but never undertaken much beyond really simple bar charts.Working with my own data motivated me to have a go to see if I could come up with something I liked whilst learning some fundamentals.
What to show
Armed with some info about what I watched, and when I watched I had a think on how to present it. My initial sketches were pretty basic, but the idea was to represent when I watched films throughout the year.
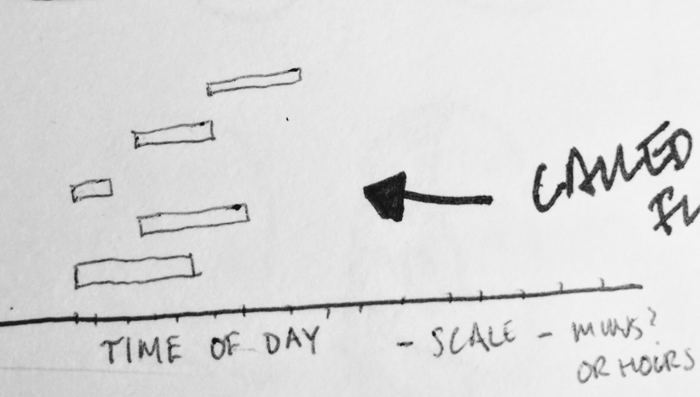 Sketching an idea
Trying to pack as much info elegantly into a chart, I thought I could represent the length of a movie with the width of a bar, placing it at the right place to represent the start time. As a sidenote, when searching for information on how to create certain types of charts within Excel or Google sheets I found it tricky to know what to look for. Turns out, the chart I’m describing above is sometimes called a Priestley Timeline, is similar to a floating bar graph or a Gantt chart.
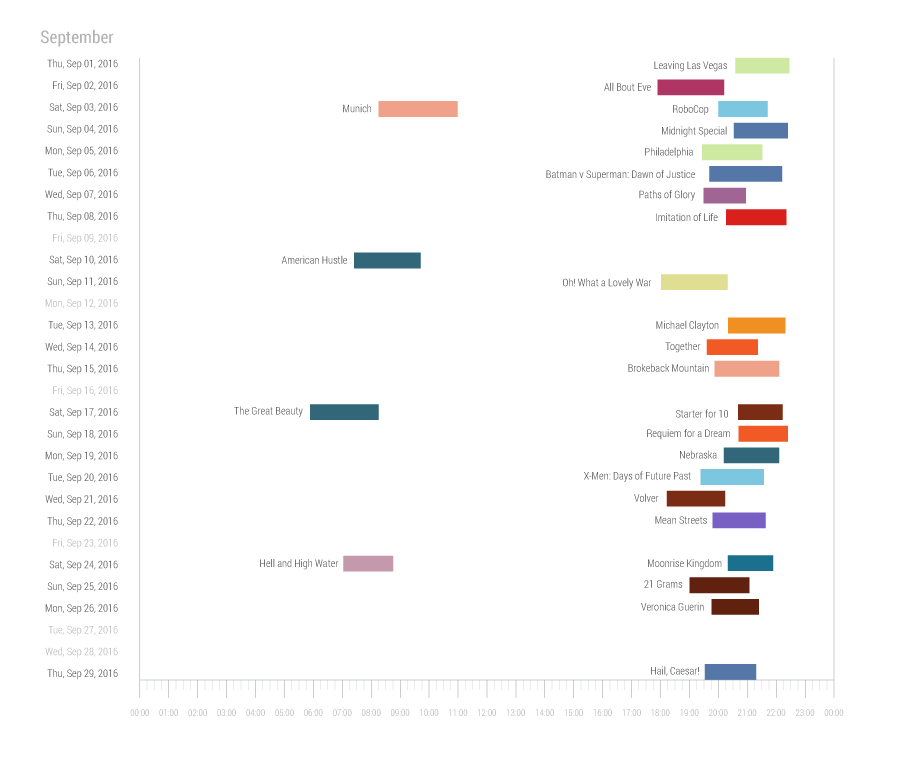 Mapping movies in a month
As you can see when using this method it works reasonably well to show a distribution of what I watched in a month, but the differences in film length aren’t that obvious. Also, distributing the films over the course of a month in this way doesn’t seem that economical a use of the space. Another property I though would be interesting to try to show was the ratings that I’ve been giving films as I watched them. I used the height of the bar to represent how many stars I gave a film, so a very thin bar would be a poor rating, - but again, it was difficult to discern the information especially since I seem to rate most films within a narrow range. The colours are also an attempt to load the chart with extra information - unsucessfully representing years. (Note to self - really must learn more about the pros and cons of using colours in charts).
Undeterred by my less successful representation in that case I thought I would try something simpler. Referring back to the spreadsheet, the question I asked was which days did I watch movies on throughout the year?
It’s easy enough to come up with the days of the week using Google Sheets
=WEEKDAY(films!B2)
Which then give me a big list of weekdays.
I then found this on stack overflow
=ArrayFormula(QUERY(A1:A142&{"",""},"select Col1, count(Col2) where Col1 != '' group by Col1 label count(Col2) 'Count'",-1))
I can then reuse the same code to do a count on just dates from months to get the monthly counts.
Over to Illustrator.
Up to this point I’ve been using rough charts in the spreadsheet, but whilst it’s ok to come up with a usable chart, there aren’t lots of options for making a nicer looking chart. So it’s over to Adobe Illustrator we go to see what we can come up with.
Illustrator has a pretty basic table interface to paste the data into, and then you have a range of common chart types to choose from. In this case a simple vertical bar chart was going to be fine as a starting point. Once the data is and Illustrator has drawn it’s version of the chart, the next step is to ungroup the chart, this making it possible to add some shine to the chart (without obscuring the important bits). In my case, I’ve overlaid some white lines to make each instance of a watched film more distinct. I’ve colour-coded the days of the week, though I’m sure there must be a lot more to think about when doing that - something to search and learn more about.
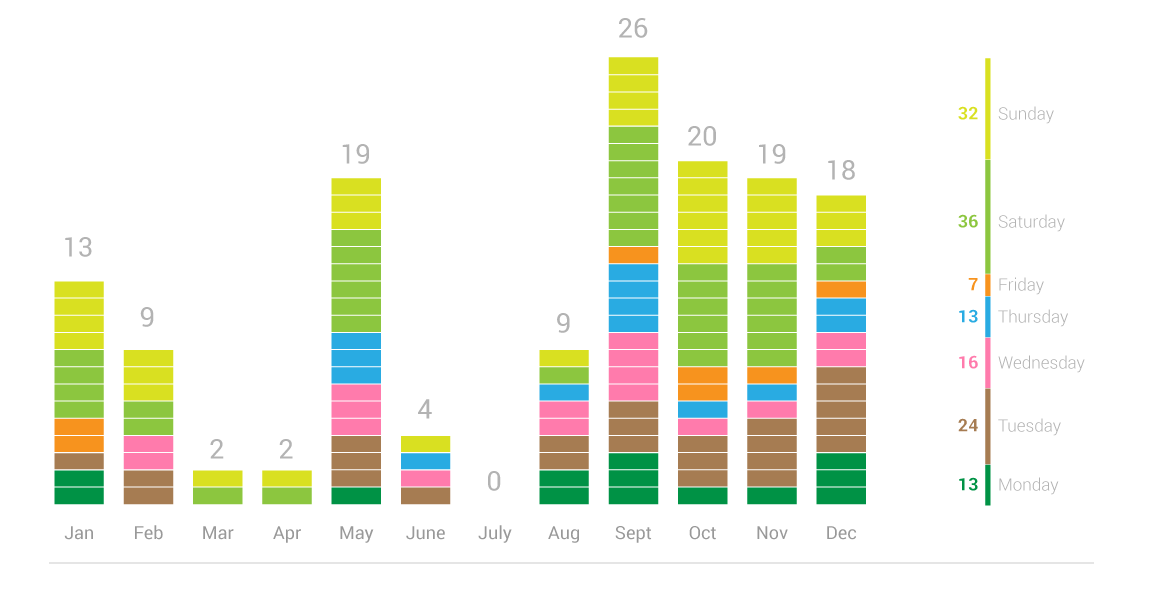 141 films in 2016 : The days I watched them on
So there you have it - a pretty simple chart with a little care taken to make it a little nicer. Way more thinking and discovery has gone into it than it appears, and it’s given me a huge appreciation of the work involved in much greater feats of data visualisation. Everybody has to start somewhere though and a healhy dose of Narcissism combined with Curiousity help me have fun with data and charts and learn a lot on the way.
Previous Next