Practical Calculated Columns in Sharepoint
Tagged: Thoughts | Posted: Sun, Jan 03, 2021 approx. 5 min read
I’ve been working in SharePoint lists a lot over the last year and have finally gotten round to writing up something I’ve found useful. I’ve written it up in the spirit of sharing that the web is so great for.
Setting review periods
Imagine you have information on important things that you want to keep up to date and needs to be shared across multiple people. A common scenario might be a list of systems that people are responsible for and should keep up to date. It sounds such a simple thing. If a team is creating documentation for itself, then they have some incentive for it work well. When the information cuts across teams it’s hard to keep it up to date, hard to keep track of whose job it is, what format is most useful and unless you establish an accompanying process the effort gets dissipated and the information decays.
Usually goes like this
“Lets put that in a spreadsheet so we can have all the useful columns that we need. It’ll be great, we’ll have tons of detail about what’s on the system, what it does, how it works, where it is and who’s responsible for it.”
“Oh wait where is it?”
“I’ll send you the latest version. Oh your version is better - hang on is it up to date?”
“Oh wait Gordon has sent me his version; that’s missing some things and he’s changed the format.”
“What’s that filename ‘really_important_spreadsheet_FINAL_SEP_Draft’”
To tackle the basic unsuitability of a spreadsheet to manage information - a SharePoint list looked like a promising candidate - It has the readability and structure that is useful and accessible in a lovely HTML page with some of the filtering and organising benefits of a spreadsheet. Aside from the obvious benefits of presenting information in a Webpage we also need to tackle the process issue of how to make it up to date. The information needs to be verified at suitable intervals to check its relevance and accuracy. Making sure there is a mechanism to keep it up to date is vital and being part of the wider Office 365 Ecosystem really helps us.
Deciding that a missing component of many of these types of systems is the concept of a record maintainer - who is responsible for the information. Once that is decided you then have a point of contact to remind.
Let’s build the list.
Create the list in SharePoint with the following columns -
- Title
- Review Classification
- Review Period
- Review Date
- Record Status
- Sensitive Data
- RAG Rating
- Description
- Supplier Info
- Data Score
I’ve used these columns as they align to similar ones I’ve used, but you can choose whatever is relevant to you.
We then add some example items with the different value that we want to try out
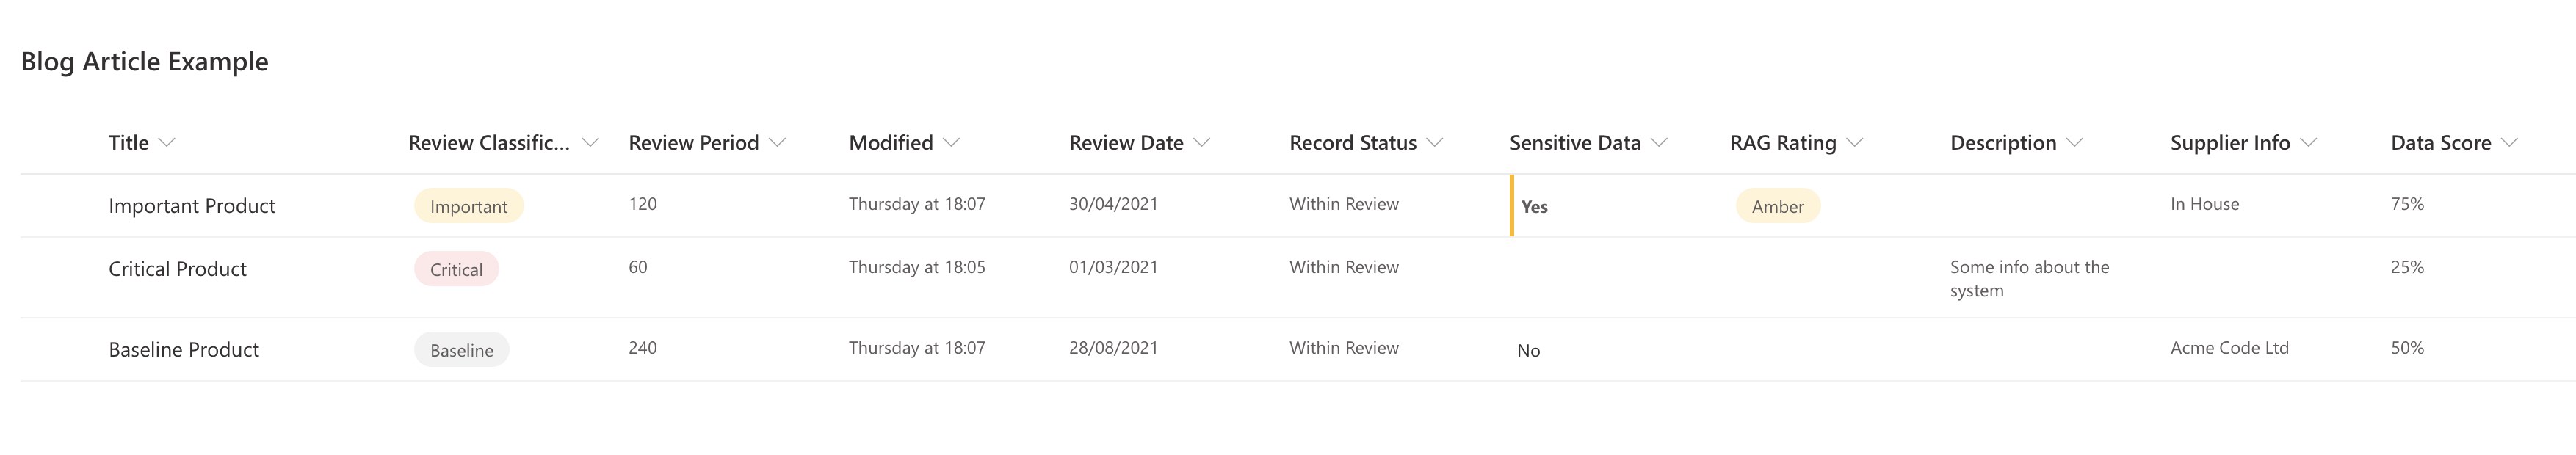
Looking closer the ‘Review Classification’ column is a choice field set to one of three choices.
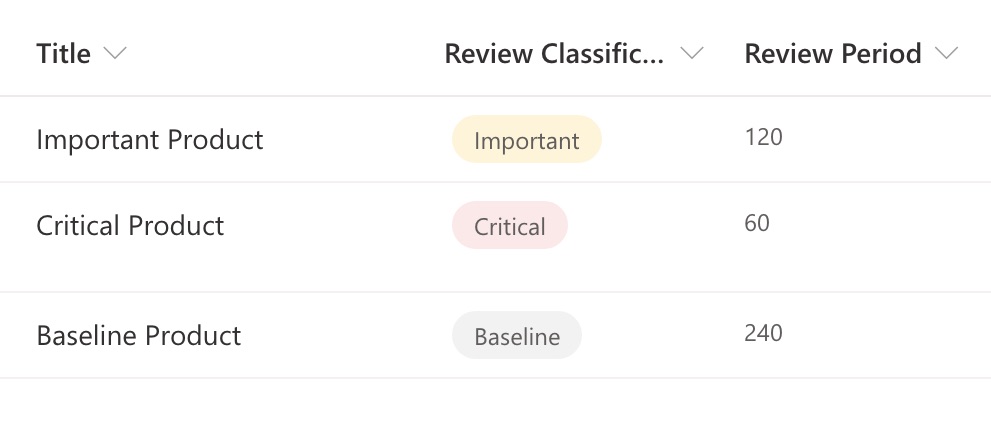
- Critical - 60 Days
- Important - 120 Days
- Baseline - 240 Days
The Review Period column is a calculated column that uses the following code:
=IF([Review Classification]="Critical",60,IF([Review Classification]="Important",120,IF([Review Classification]="Baseline",240)))
This sets a period in days to correspond to each of the options - this is where you could make the periods what you want.
Which brings us on to the ‘Review Date’ Column.
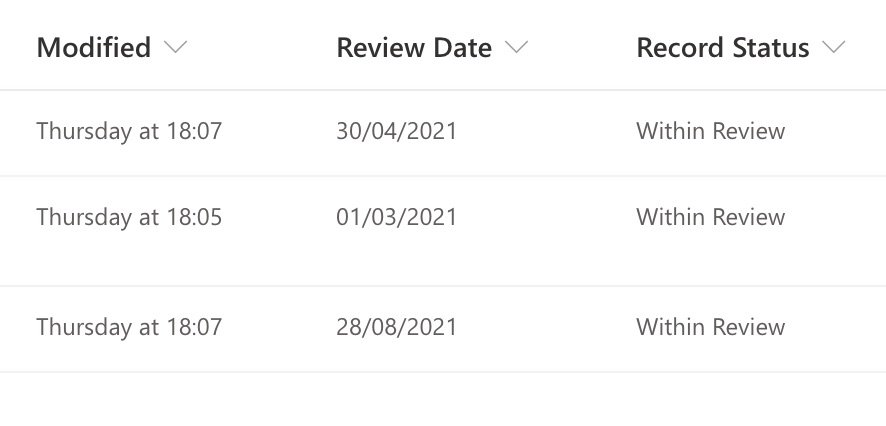
It is a calculated column with the following simple calculation.
=Modified+ReviewPeriod
Which adds the number of days set by in Review Period to the last date the record was modified. This means is the record has been modified during the review period it effectively resets it. For a little extra convenince I then have a column ‘Record Status’. This is handy to quickly see if a record has expired rather than reading a date - it also provides a useful trigger for Notification Flows.
=IF(TODAY()<ReviewDate,"Within Review","Expired")
This brings me onto the other calculations in the list.
Data Quality
For the list to be useful as well as being up to date, we also need the information to be as comprehensive as is practical. In an ideal world we would have every column completed for every record, giving a detailed picture of whatever we wanted. One way to help could be to have a basic metric on the quality of the information. We can do this by checking if columns we deem important have been filled in.
In the ‘Data Completeness Score’ ccolumn there is a calculation that checks if a column is not empty.
=COUNTA([Sensitive Data],[Review Classification],RAGRating,[Product Status])/4
You can read more about the function at on Microsoft’s Help Site.The first part of the calculation checks if the columns are not empty, and then is divided by 4 (the number of columns being checked) In the options for the column in SharePoint, the option to represent it as a percentage then gives us the score for the Column. So, for a list the following example columns could be
- Sensitive Data
- RAGRating
- Description
- Supplier Info
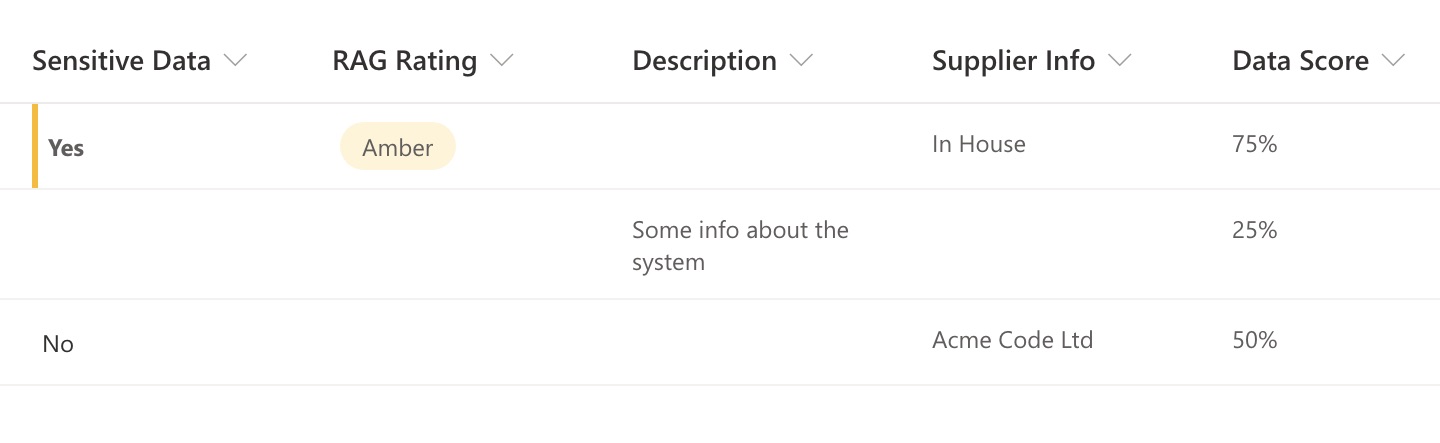
If three are filled in that would give us a ‘Data Quality’ score of 75%. As you can see, currently I’ve chosen four fields as most important, but you could have more and change the calculation to reflect that. Once you have defined a set of essential information you can check for them and see what records need attention.
All of this work was a development and essentially ‘sketching’ in a nice protected environment to see what lists can do. I’m pretty pleased with what’s possible - especially with the twin constraints of my ability and Office 365.
Hope you’ve found this an interesting exploration of the kind of simple things that are possible in SharePoint lists. Allied to some decent processes it can be be pretty powerful.
Previous Next